Using eBPF-powered Tetragon for Kernel Observability
Like many half-finished side projects sitting in my brain’s garage, I’ve always wanted to write a series about monitoring and observability. It’s such a broad topic that I could approach it from many different angles: fundamental concepts and common misconceptions, different tools, practical use cases, existing research studies, and much more — and before I knew it, what started as a blog post could have turned into an entire research paper 🙈. Instead of aiming for a complete study from the start, I wanted to take a fast, hands-on approach with Tetragon. Similar to my previous one-week challenge on Aya, I gave myself another seven-day challenge to learn, experiment, and document how far I could get.
Let’s dive in!
What Is Observability?
Based on my understanding, and explaining it as a non-native English speaker, I like to to split the word into two parts: the ability to observe. I would describe it as how much insight we can obtain from a running system. In other words, it demonstrates how well we can understand what a computing unit is doing while it is running.
By doing this, one method is monitoring.
As the name suggests,
monitoring system is typically an always-running daemon that continuously “peeks” at workloads or other systems.
The information it collects is called metrics.
Metrics are numerical data that describe the state or behavior of a system,
either at a specific point in time or aggregated over a period. For example:
At 5:10 PM today, Container A was using 100 MB of RAM and
Since last Monday, the system has processed 100 requests.
Oh, let me advertise my published project for a moment – Colibri – it is a lightweight monitoring system for mobile edge system.
One Observability Example: Tracing
The other two data types support observability are logs and traces. Traces are generated by tracing systems, so they are out of the scope of monitoring systems. The figure below shows some examples of tracing software (Borrowed directly from my PhD thesis. I guess this proves I’m writing this post at full speed 👩🏻<200d>💻):
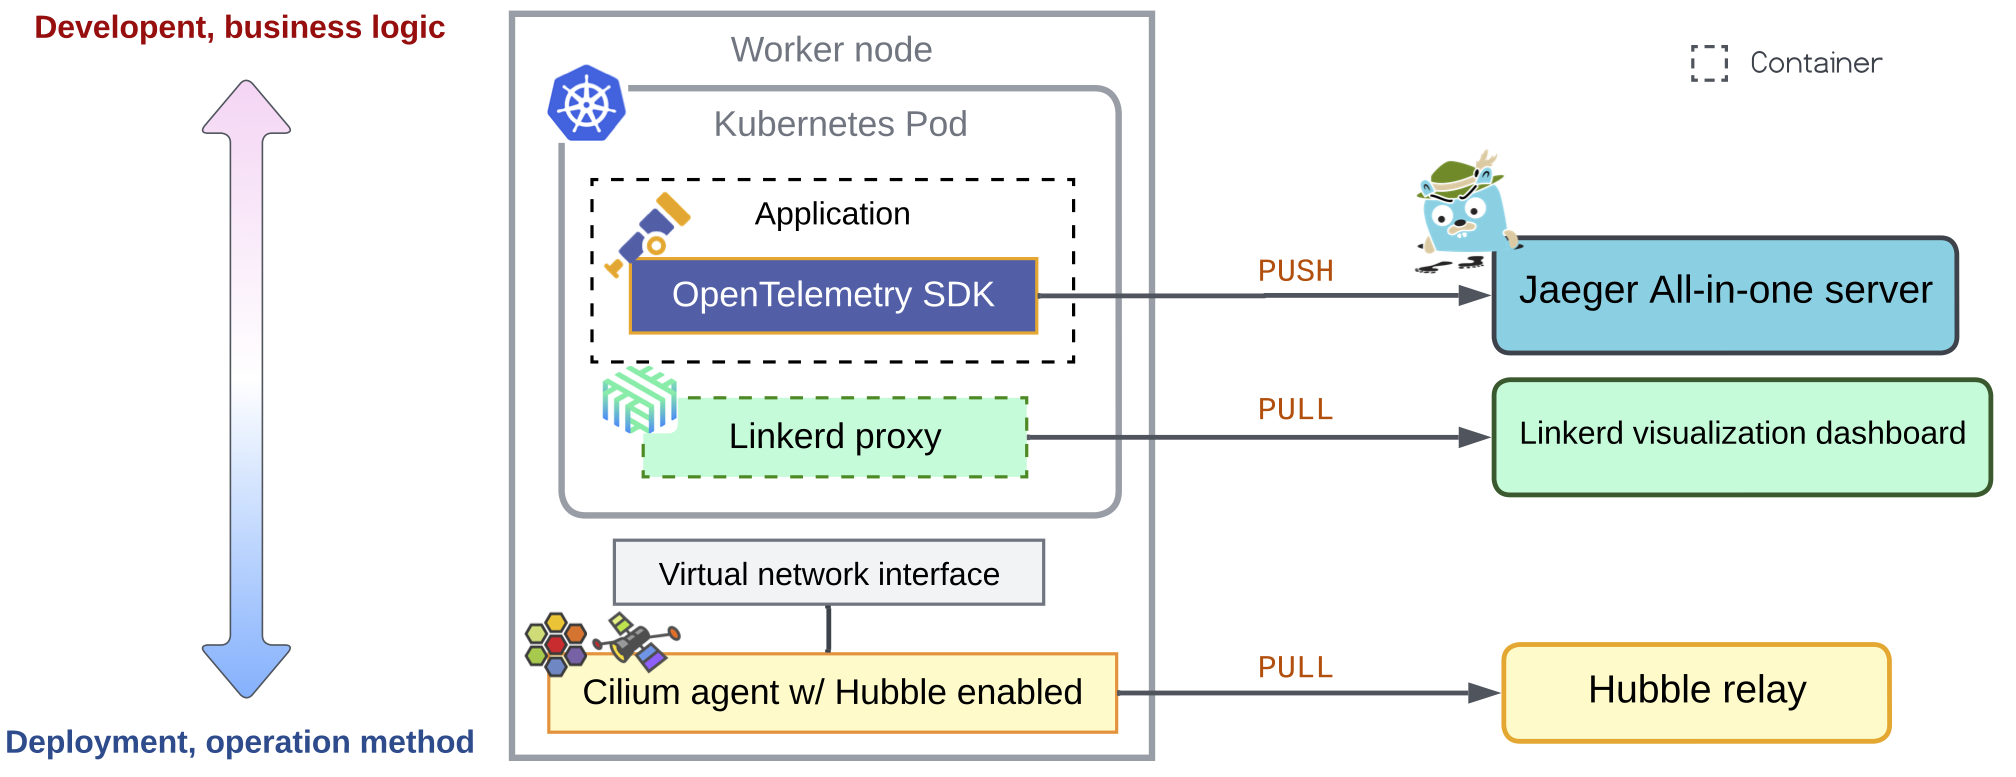
Jaeger is a popular, open-sourced tracing system originally developed by Uber. There has been so many research and techniques built around distributed tracing1. What is tracing/trace used for? It captures the end-to-end request workflow across the entire application or system. Each data unit (span) of a trace contains details such as the executed function, timestamps, and duration, helping with identifying bottlenecks and debugging potential application issues. In the figure, I compare Jaeger with the service mesh Linkerd and Cilium’s Hubble. These two are not iconic tracing systems. But, when workloads are built as microservices, both of them can observe the communication and request flows between the services with much less instrumentation. By sharing this, I want to illustrate that there are many alternatives to improve the observability of your system, the tracing system like Jaeger is not the only option.
Tetragon: Kernel-level Observability with eBPF
Also shown in the figure, Cilium, as one of famous CNI implementations, includes an advanced observability component called Hubble, which provides network observability for container workloads. Since Cilium is responsible for managing container networking, it naturally has visibility into network traffic. Hubble builds on top of this capability by collecting and presenting networking events, and allows users to filter the events. The actual networking operations and policy control are still handled by Cilium.
Nevertheless, Isovalent has another product called Tetragon, which is the main topic of this post. (Oké, eindelijk zijn we hier!) Take a look at its headline in official documentation:
Cilium Tetragon component enables powerful realtime, eBPF-based security observability and runtime enforcement.
From it, we can already learn several things:
Though they prefixes the name as Cilium Tetragon, but I think they are different products, and they can also work independently.
Like Cilium, Tetragon is implemented with eBPF.
Tetragon focuses on security observability. Security is not my area of expertise, so I won’t evaluate how effective it is as a security solution. I’ll mainly discuss it from a systems perspective.
Except observability, Tetragon can also perform runtime enforcement, which means it can react to specific events instead of only observing them.
The headline emphasizes realtime and runtime. I think this is one interesting aspect of Tetragon. Thanks to eBPF, it can observe events and enforce policies directly inside the kernel with very low latency. Later in this post, I’ll share some measurements of its observation and enforcement latency. However, I won’t try to judge whether those numbers are good enough for security-critical situations.
Deployment
According to the official deployment steps, there are two setup methods: as part of the K8s cluster, or running standalone in a Docker container. The difference between them is that, in the cluster deployment, Tetragon runs as a DaemonSet. This means one Tetragon Pod is deployed on every node in the cluster. Each host agent has the privileged to collect kernel events locally.
I followed the K8s installation process, where Tetragon is deployed through a Helm chart.
As mentioned in the previous section, the chart is maintained in the same Helm repository as Cilium,
although I still think they deserve separate repositories. 😅
Besides deploying the required components (such as the Tetragon DaemonSet that runs one agent per node),
the Helm chart also installs several new resource types (CRDs). The most important one is TracingPolicy.2
A TracingPolicy defines which events Tetragon should observe and
what actions it should take when those events occur.
This also shows that Tetragon’s runtime enforcement is orchestrated through Kubernetes.
Users can create, update, and manage tracing policies
using the Kubernetes API or familiar command-line tools such as kubectl.
However, when using the standalone Docker deployment,
policy updates require restarting the Tetragon container with the updated policy file.
This is definitely not practical in a production environment.
TracingPolicy
To demonstrate how to configure a TracingPolicy, and also to document my own learning process, let’s walk through one of the examples from the official tutorial: a TracingPolicy that prevents files from being accessed. I will discuss the configurations in order and talk more about the important parameters by category:
CRD type and identity awareness
apiVersion: cilium.io/v1alpha1
kind: TracingPolicyNamespaced
metadata:
  name: "file-monitoring-filtered"
The first thing you might notice is the naming of CRD.
Why is it TracingPolicyNamespaced instead of simply TracingPolicy?
It is because this “-Namespaced” postfix one is only applied/workable within the specific K8s namespace.
In contrast, TracingPolicy is cluster-wise and can affect workloads across the entire cluster.
A TracingPolicyNamespaced object is associated with a namespace either by
specifying the metadata.namespace field in the configuration template or
by providing the -n (--namespace) option when creating the resource with kubectl.
The official documentation discusses more advanced identity selection mechanisms. In particular, Tetragon provides additional configuration options for defining fine-grained enforcement conditions across the compute resources and units like nodes, Pods, and containers.
Tracing hook
spec:
  kprobes:
  - call: "security_file_permission"
    syscall: false
    return: true
    returnArg:
      index: 0
      type: "int"
    args:
    - index: 0
      type: "file" # (struct file *) used for getting the path
    - index: 1
      type: "int" # 0x04 is MAY_READ, 0x02 is MAY_WRITE
The spec section is the core configuration part defining where this tracing policy should be operated.
First, the keyword field put right after the spec specifies the hook (at the time of writing,
Tetragon supports 6 hook types).
The call field in the hook type indicates which kernel function to attach to, while
the syscall tag implies if this function is a system call or not.
In this example, this tracing policy is in type of kprobe and hooks
on security_file_permission, and it is not a system call.
The return and returnArg define whether to capture the return value (the result) of the function
and what is its type.
The args describes the input parameters of this hooked function.
If you further compare the source code of Linux kernel with this example, they are exactly
matched.
Although TracingPolicy is expressed as a resource in K8s,
its tracing hooks are ultimately defined by the Linux kernel itself.
Again, if we’d like to explore the available hook types and their capabilities in more depth, the official documentation has those information. Filling a post with many external links is tiresome 🥲 (to me and to the readers). But I believe that learning a technique, diving into the content providing by the main contributers is significant and so as to gain the most accurate knowledge.
Target selection
The following snippet continues the configuration of the security_file_permission hook:
    selectors:
    - matchArgs:
      - index: 0
        operator: "Prefix"
        values:
        - "/boot"       # Reads to sensitive directories
        - "/root/.ssh"  # Reads to sensitive files we want to know about
        - "/etc/shadow"
        - "/etc/profile"
        - "/etc/sudoers"
        :
      - index: 1
        operator: "Equal"
        values:
        - "4" # MAY_READ
      matchActions:
      - action: Sigkill
This is the rule-matching part of the policy. Tetragon evaluates each invocation of the hooked function against the configured selectors. If the matching conditions are satisfied, it is possible for Tetragon to perform the corresponding actions. In this example, it checks whether the file path begins with one of the listed prefixes. which also means any file under these directories is also considered a match. And, policy only applies to read operations. When both conditions are met, Tetragon sends a SIGKILL signal to terminate the offending process immediately.
Understanding TracingPolicy configurations, or writing your own policies from scratch, usually means spending plenty of time reading the API reference. This is the process as we learn any new API, protocol, library, or framework with a well-defined specification. Furthermore, the Tetragon repository contains many example TracingPolicies covering different use cases. Besides learning the configuration syntax, studying these examples is also a great way to build intuition about Linux security mechanisms and the kernel hooks that make them possible.
Hackathon! Building a Malicious gRPC workload
I have finished Tetragon’s official tutorial and Isovalent’s hands-on lab. To really make the knowledge stick, I think nothing beats building something yourself. So I quickly came up with a small hackathon project.
- Two components communicate through gRPC. The client acts as the attacker, while the server hosts a malicious component that simulates a backdoor.
- The “victim” machine runs Tetragon to observe and enforce security policies.
- The gRPC client sends a series of malicious requests, such as reading sensitive files or attempting to exfiltrate confidential information.
My goals for this mini-project are:
- Can the toy attack successfully perform the intended malicious actions?
- Can Tetragon detect and log these malicious events?
- How does Tetragon prevent these actions and generate alerts? More importantly, what are its limitations?
I will share this project once I finish 🥹 (To be continued)
Mini-Detour: What is gRPC
Before talking of what is gRPC, we should talk of what is RPC. This is a popular question around the communication of distributed system.
Published tracing systems grouped by the organizations: Dapper (Google, 2010), Zipkin (Twitter, 2012), Jaeger/CRISP (Uber, 2015/ATC'22), Pivot tracing/Canopy (Meta, SOSP'15/‘17). There is another ATC'23 paper from Meta but one of the authors Yuri Shkuro is the creator of Jaeger. I love these gossips 😈. ↩︎
As TracingPolicy is a CRD, the Tetragon Helm chart also deploys the Tetragon Operator to manage TracingPolicy resources (along with other CRDs). The interactions between the Operator, the CRDs, and the Tetragon agents are an interesting topic worth exploring in more detail. For now, here’s my current guess (pending a second-pass validation): When the Tetragon Operator detects that a new TracingPolicy has been created, it likely propagates the policy to all Tetragon agents so they can enforce it locally. Likewise, when an existing TracingPolicy is updated or deleted, the Operator is expected to distribute the corresponding changes to every agent. If we want to benchmark how “realtime” Tetragon’s enforcement is, this control-plane communication delay may become part of the critical path. ↩︎
Author Carol Hsu
LastMod 2026-08-07 (c2f530c)
License All rights reserved. Feel free to reach out with any questions.